Historically, characterization efforts were based largely on soil borings for soil sampling and monitoring wells for ground and nonaqueous phase liquid sampling. The bias of collecting soil samples from the unsaturated zone limited the ability to understand contaminant mass distribution, especially in finer-grained soils where groundwater sampling is impractical due to low yields.
Conventional soil and groundwater methods typically used a linear strategy of relatively coarse subsurface interval sampling—for example, one sample every 5 feet for soils or a 10-foot well screen for monitoring wells. This historical convention involved subjecting all samples to rigorous quality control to ensure precision and accuracy. This method was costly and it reinforced the paradigm of collecting relatively few (but very high-quality) samples. The primary drawback, however, was that the sampling frequency was not based on the scale of variability or the process controlling the distribution of contaminants in the subsurface—that is, hydrostratigraphy. Thus, conceptual site models (CSMs) developed from conventional characterization methods, while often founded in precise data, provided an inaccurate understanding of the nature and distribution of contaminant mass.
The newer direct-sensing tools (for example, membrane interface probes, and optical screening tools) provide practitioners with mapping capability at resolutions that were previously unattainable. Integrated site characterization takes advantage of new tools to characterize the site stratigraphy and contaminant distribution at high-resolution (up to centimeter scale) in a nearly real-time manner; however, real-time, high-resolution sampling is only part of the integrated site characterization approach. The key is applying the methods in the context of a dense nonaqueous phase liquid (DNAPL) CSM that evolves as several lines of inquiry are combined and iteratively refined during the project life cycle—through site investigation, remedy design, and remedy optimization.
Over the past several decades, data have been collected and some form of CSM has been developed for many complex groundwater sites. The quality of the collected data, level of interpretation, and sophistication of the resulting CSMs for these sites has varied considerably. When scrutiny of these sites increases due to regulatory or commercial interest, financial prudence dictates that the existing site data and CSM be evaluated in light of modern concepts of DNAPL behavior to maximize the efficiency of any additional required data collection. This process includes the phased approach identified in Chapter 4, with examples provided below.
This review phase is focused on establishing what is known about the scales of lithologic heterogeneity laterally and vertically, understanding the hydrostratigraphic framework and how it was constructed, and determining the impact of existing data resolution on the reliability and usability of the existing CSM. The steps to take, and associated questions to ask, are outlined below.
Existing lithologic data vintages should be reviewed and vertical resolution determined. Otherwise stated, are there continuous lithologic data in the form of high-quality continuous core descriptions? Logs of such cores may contain valuable information, including bedding thickness, degree of interbedding of fine- and coarse-grained lithology, indications of clay types and content, and descriptions of sedimentary structures. Do vintage cone penetrometer data exist, or only 18 inch samples every 5 feet with United Soil Classification System (USCS) classification? Can cone penetrometer data be calibrated against lithologic descriptions or analytical data, and thus serve as a proxy for lithologic data?
In cases where fracture porosity dominates fluid flow and contaminant transport, have sufficient data been acquired to characterize the fractures in terms of spatial orientation, distribution, and potential to transport or store contaminants?
Once there is an understanding of the different vintages of data collected, the data can be ranked according to reliability and resolution so that continuous (high-resolution) data, as well as logs with good sedimentologic/stratigraphic detail, can be given greater weight in the analysis of the existing CSM.
Once the strengths and weaknesses and vertical and lateral resolution of the existing lithology data set are understood, hydrogeologic and chemistry data can be accurately viewed and the existing CSM can be assessed. Critical to the CSM review is determining whether the depositional environment has been sufficiently considered and whether the architecture depicted by the CSM is consistent with depositional models corresponding to that environment. An integrated, geologically defensible CSM incorporates depositional models and provides a powerful roadmap for evaluating any additional data and identifying the correct amount and type of data required to answer the questions and advance the site status. While the importance of adhering to classical geologic methods and principles has been discussed in the groundwater remediation industry for many years, few have applied it in practice. A brief discussion of depositional environments and some practical guidance on how they can be applied to groundwater remediation data sets and CSMs is provided below. If an existing CSM shows major diversion from geologic processes and is therefore geologically infeasible, or if the CSM fails to provide an explanation for observed phenomena (that is, it contains many outlier data), a revised CSM should be developed.
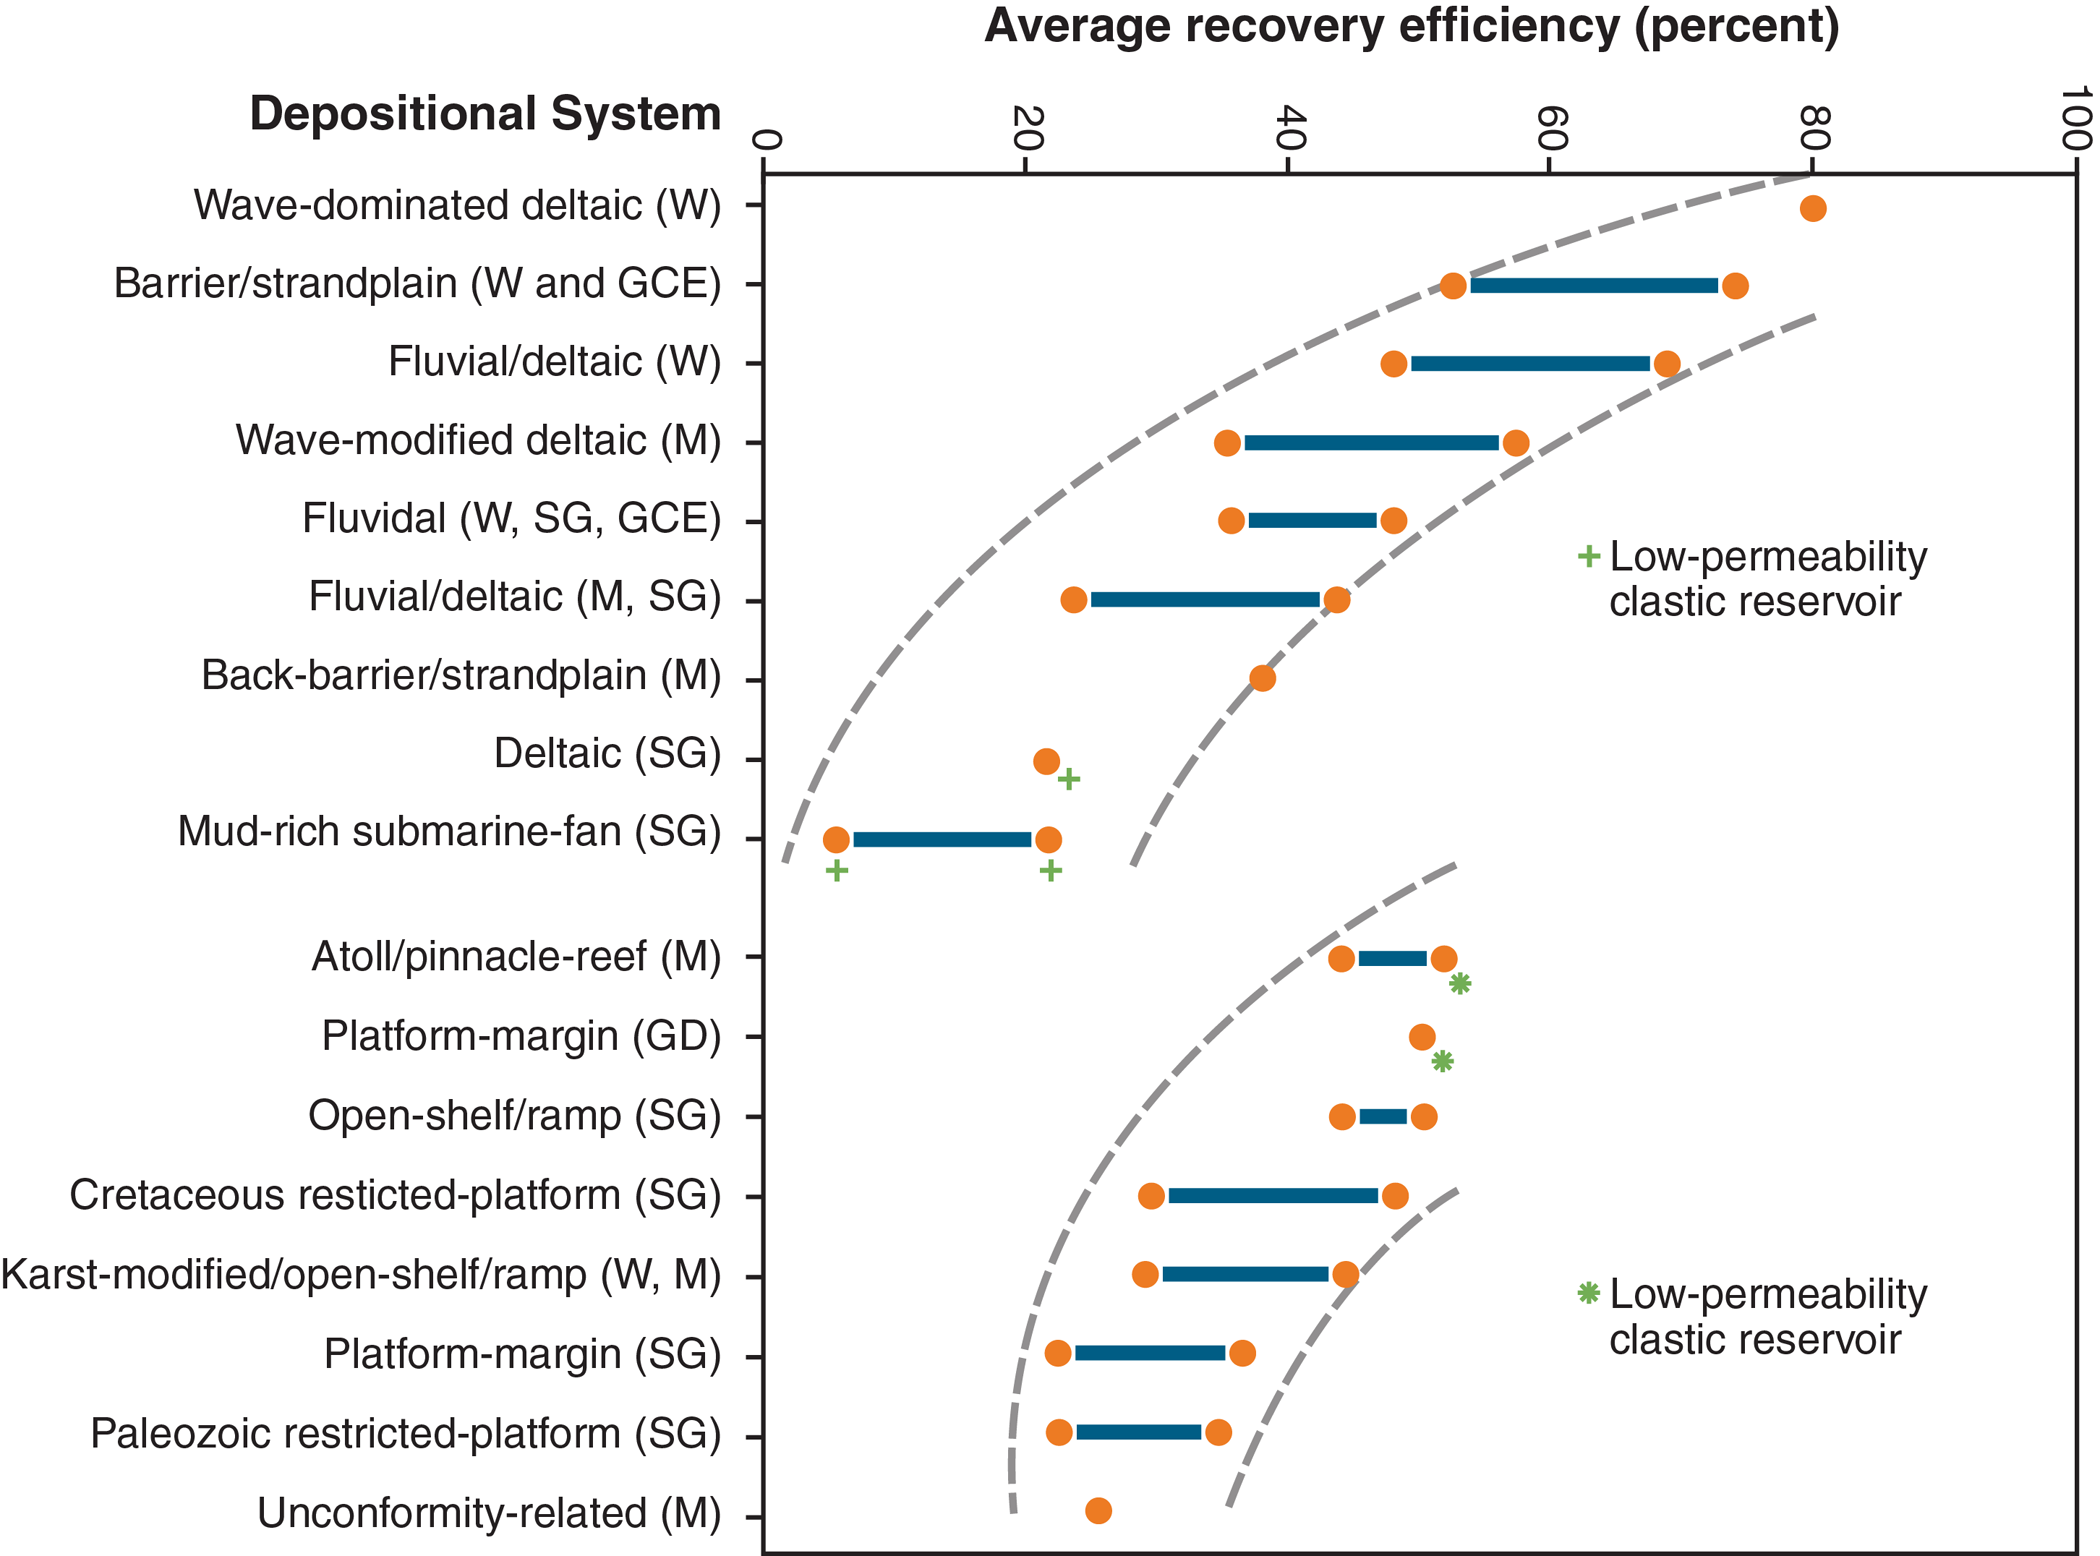
The impact of depositional environment on permeability heterogeneity has long been studied in the context of hydrocarbon production. Figure A-1 shows hydrocarbon recovery plotted according to depositional environment. While this plot sparked considerable controversy, the idea that different depositional environments have inherent differences in connectivity is represented by recovery efficiency. In relation to DNAPL contamination, this can be equated to potential for matrix diffusion processes to dominate. In other words, if a DNAPL is released into a deltaic depositional system, it is expected to be more contained than in a barrier island complex, but may be more likely to become incorporated into the matrix and thus provide a long-term contaminant source. This is due to a greater degree of heterogeneity and channelization in deltaic deposits, as well as an increased percentage of fines.
Figure A-1. Cross-plot of recovery-efficiency range versus depositional system and drive mechanism for major sandstone and carbonate reservoirs in Texas showing decreasing recovery efficiency with increasing reservoir complexity. Drive mechanisms: W - water; GCE - gas cap expansion; GD - gravity drainage; SG - solution gas; M - mixed (combination of W, GCE, and SG).
Source: Courtesy of Mike Shultz; modified from Tyler et al. (1984).
In many cases, important details recorded in vintage boring logs can be used to extract valuable stratigraphic information that can be used to develop or refine a CSM. Figure A-2 illustrates this concept.
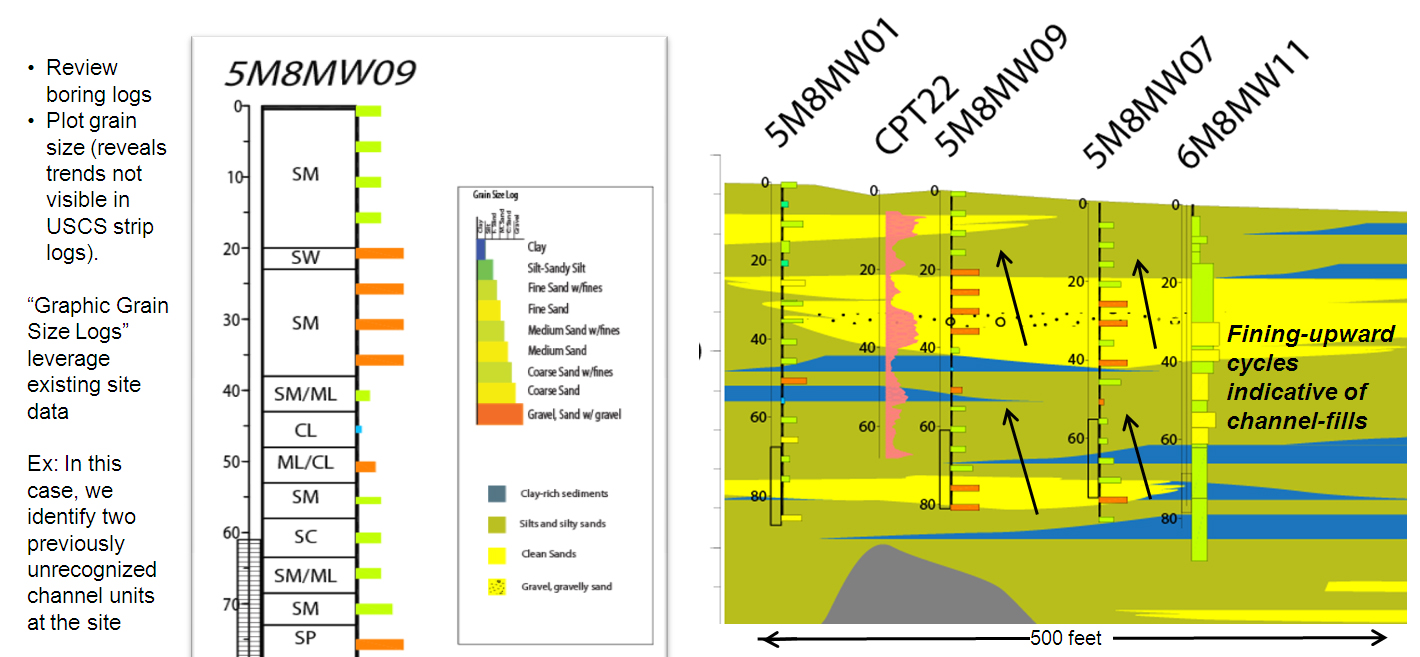
Figure A-2. Grain size log.
Source: Courtesy of Mike Shultz.
At the complex site illustrated in Figure A-2, as is typical of many sites, the USCS codes were posted on well bores and used to correlate the subsurface materials, resulting in a view of the hydrostratigraphy that precluded mapping of the subsurface permeability architecture; however, when boring logs from the site were reviewed to address data outliers, it became clear that the geologist who logged the borings for monitoring well installation recorded information beyond the USCS classification. In this case, samples were taken at 5 ft intervals, and the maximum grain size identified in each sample in the boring log was posted on the cross section as deflection from the vertical axis. Two fining-upward trends were recognized, and these sequences were consistent from boring to boring. These fining-upward cycles represent two episodes of channel erosion and deposition stacked vertically, consistent with depositional models for fluvial deposits. In addition, the fluvial models predict high permeability at the bases of the channels. While not all sites have adequate data to perform such work, when possible, this frees the geologist from the limitations of the USCS classification system, and provides a means to “normalize” lithology data collected by disparate field data collection techniques over many years and by different field geologists. In this case, great value was extracted from vintage data (that were acquired at significant cost), providing a framework for any future data collection. In addition, identification of these channels led to a prediction: all channels have margins, and channel margins are finer-grained and represent likely areas for contaminant storage. When the depositional environment corresponding to a site is determined (either from regional work or site data such as the grain size trends outlined above), a host of predictions that bear directly on DNAPL site CSMs can be made. These predictions are important when planning or analyzing any high-resolution data sets (see chart below).
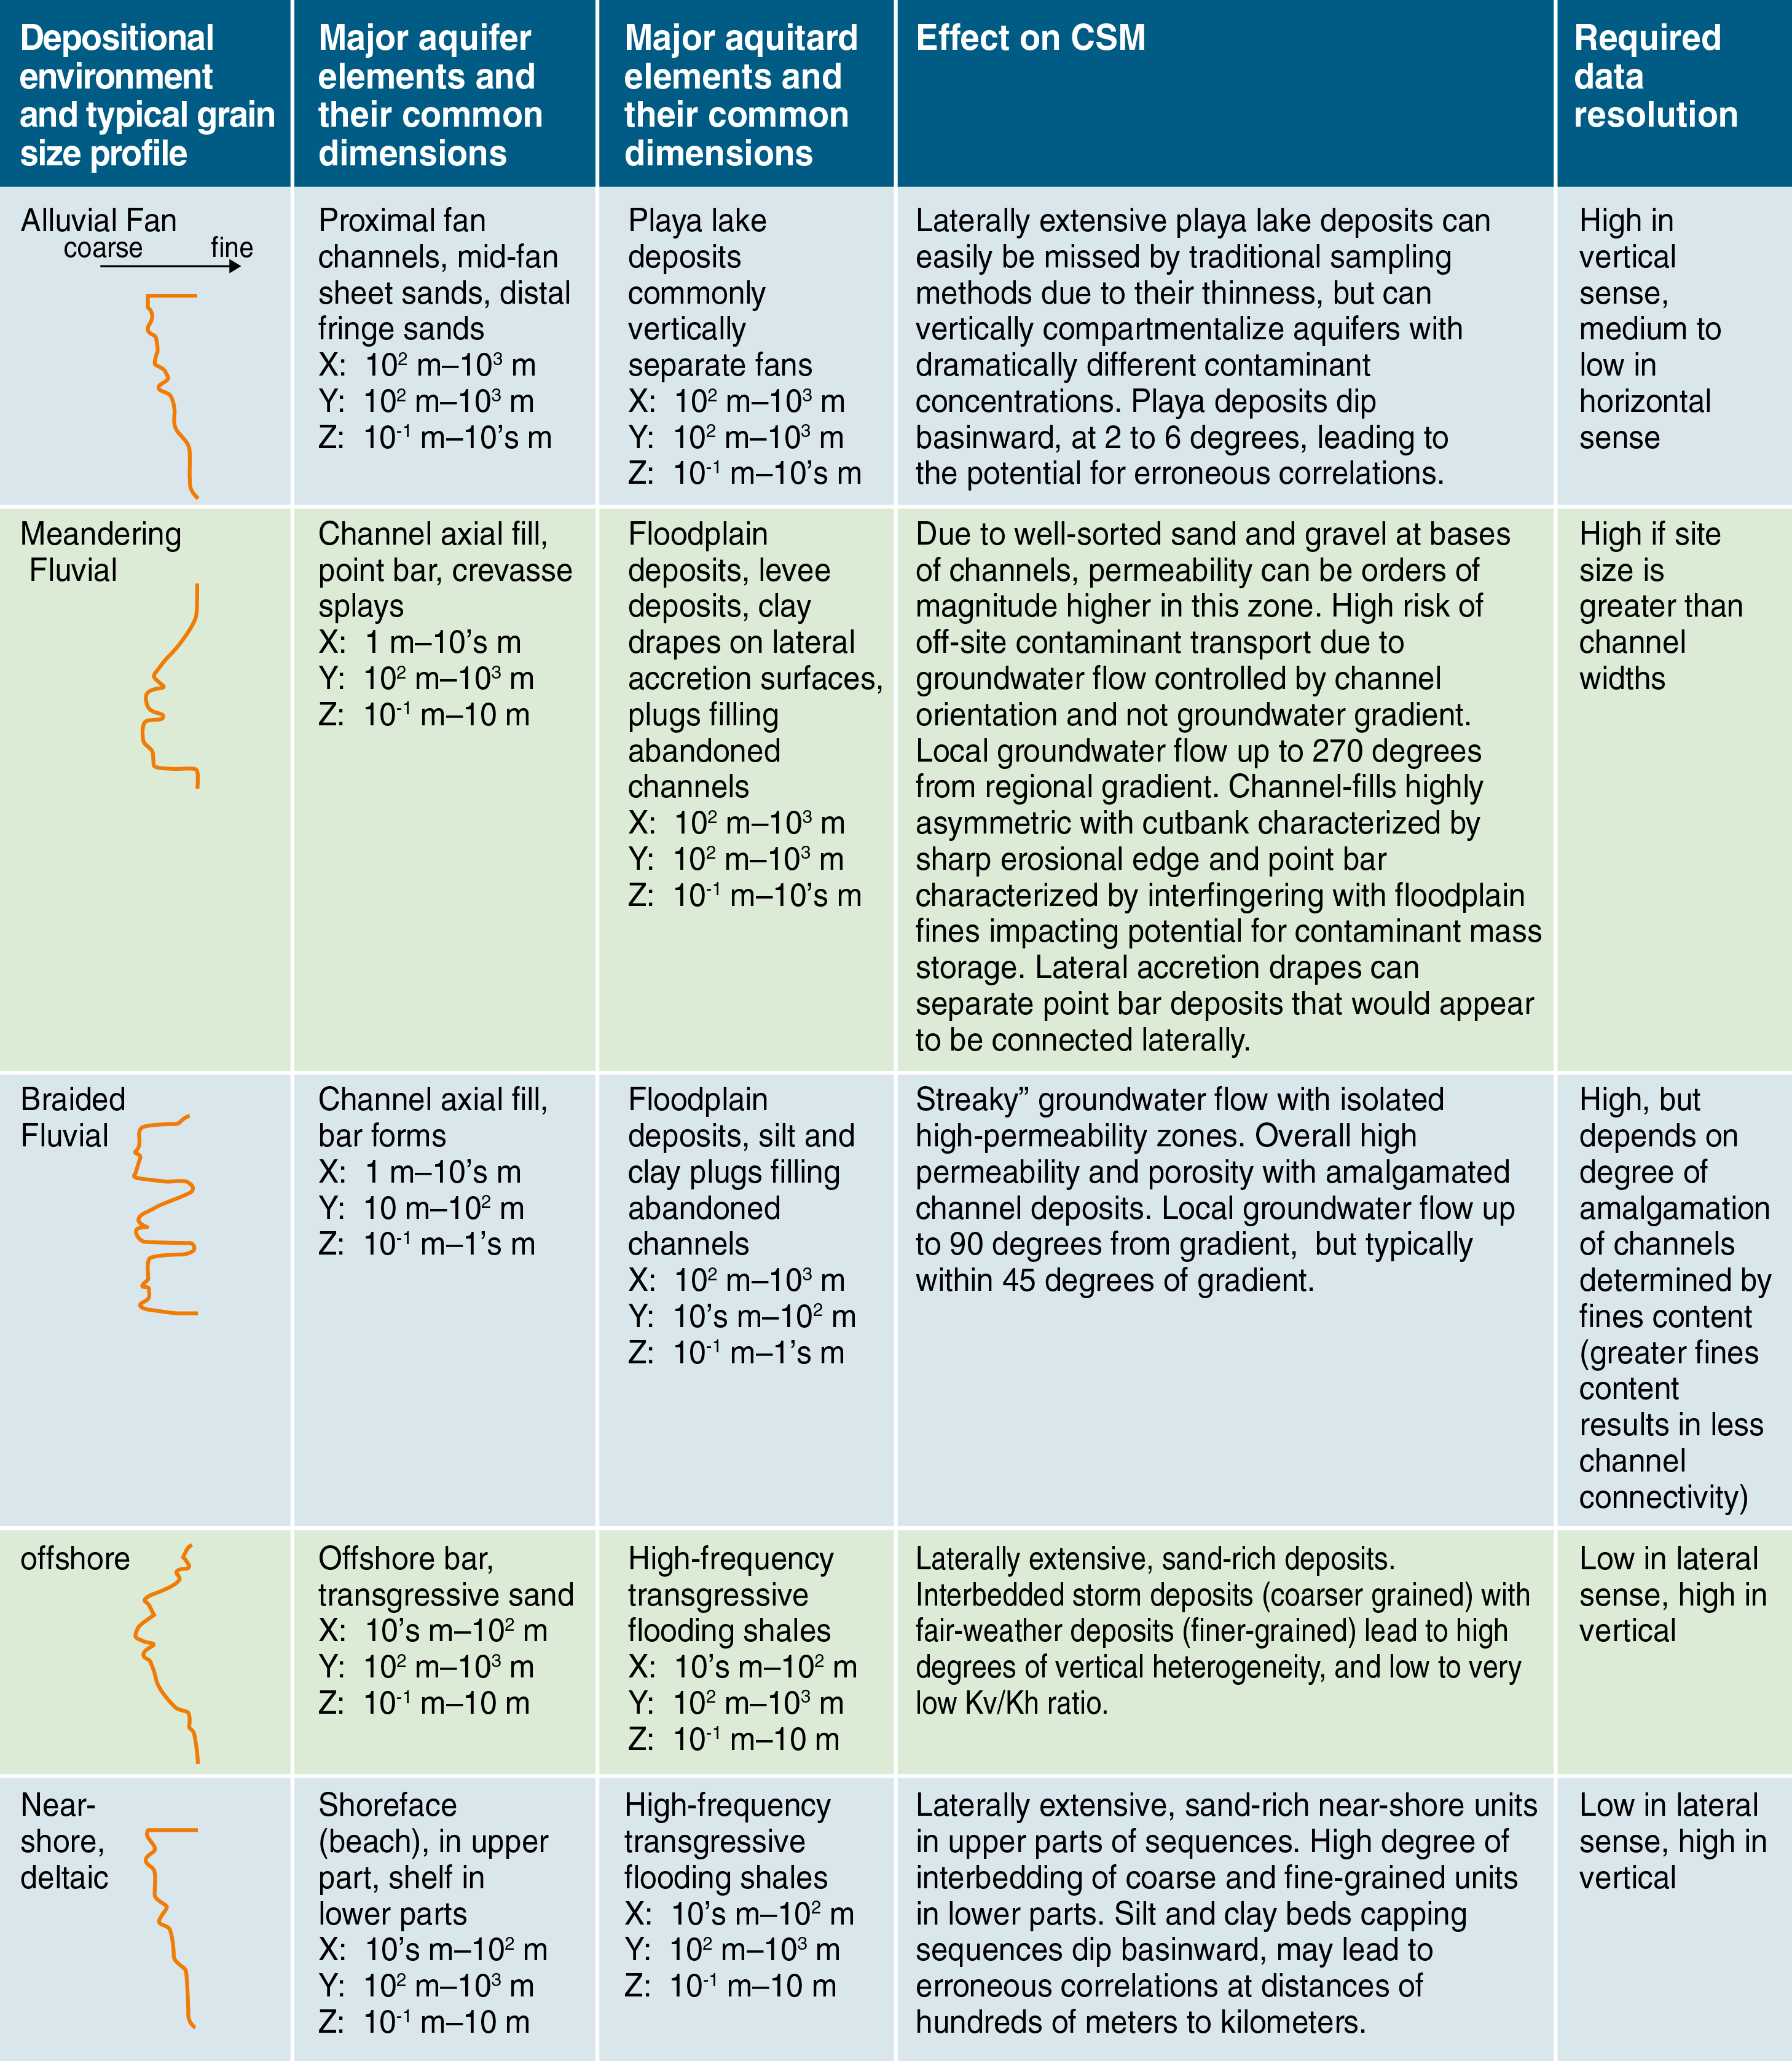
Figure A-3. Illustration of grain size profile of depositional environments and the potential effect that grain size distribution may have on CSMs.
Source: Courtesy of Mike Shultz.
Well screens and relationships to stratigraphy should be reviewed and hydrogeologic data (for example, pump tests) should be integrated to determine whether permeability can be directly correlated with lithology and chemistry data. In addition to validating the association of hydrostratigraphic units, this will also determine the potential for fine-grained units to be long-term contributors to a dissolved-phase plume. If the lithology and geology are simple, 10 ft well screens may be adequate; if the geology is complex, higher-resolution data may be required. For example, a well screened entirely in a coarse-grained unit may show different concentration data historically as the site evolves—that is, as contaminants become progressively incorporated into fine-grained lithologies and coarse-grained lithologies become flushed. Are lithologic data of sufficient resolution to illustrate the likely proportion of fine-grained material intersected by the screen, so that the contribution of the fine-grained intervals to any ongoing matrix diffusion sources can be determined? Accurate representation of data resolution on cross sections and maps, such as the example on Figure A-2, allows for analysis of screened intervals relative to hydrostratigraphy and identification of the degree of uncertainty not previously possible at the site.
What interpretive liberties were taken that impact its uncertainties? Are alternative correlations possible? How would these impact the CSM?
A solid understanding of data collected and work performed at the site to date, coupled with a hydrostratigraphic framework founded on the concepts of facies and depositional environments, provides a clear picture of what is known about the subsurface and a road map for identifying data gaps and developing data collection objectives.
Data outliers should be identified and, if they are artifacts of data resolution, hypotheses for this should be developed.
All remedial actions, past and present, as well as any off-site conditions that impact the CSM (for example, contaminants entering the site, groundwater pumping) should be reviewed. The scale of fluctuation of the stratigraphy and contaminant distribution in the subsurface should be classified. This process requires careful definition of the data quality objectives so the proper tools can be selected to provide sufficient resolution and accuracy for classifying the behavior and distribution of contaminants and stratigraphy. Often, site-specific calibration and verification are required to determine the limits of applicability and utility of selected tools to meet screening and quantitative objectives before full-scale characterization efforts are undertaken.
In complex geologic settings, or where DNAPL is encountered, it is not possible to explicitly characterize and map the individual centimeter-scale beds comprising an interbedded facies or DNAPL ganglia in space; however, it is practical to use classical geological methods to interpret and map the stratigraphy in terms of hydrofacies (which might include mapping an interbedded zone that controls the distribution of the DNAPL ganglia in the aquifer) and to then classify and map the composite zone (which contains DNAPL). Identification of depositional environments is often possible from regional information or site information, and depositional models should be applied throughout the process.
If not available in the existing CSM, the model should be refined by quantitatively linking the stratigraphy and permeability of the aquifer so that transport zones can be distinguished from storage zones and mapped across the investigation area. In essence, this phase of characterization focuses on selecting and using tools that can map the mass flux in the aquifer. This is where the application of data collection transects is required. High-resolution data collection may be necessary to ensure adequate horizontal and vertical resolution to understand transport at the site. The major historical flaw was assuming that a plume could be accurately mapped from the outside in, by stepping out at large distances from the source to map the spatial extents, without understanding how mass flux is controlled. It is important to recognize that different tools or combinations of tools are required to accurately detect and map the occurrence of DNAPL and high-concentration source zones, compared to moderate- or MCL-level concentrations in the distal portions of the plume in the subsurface. Further, different tools are required to provide quantitative measurements of dissolved-phase contaminants in permeable transport zones compared to less permeable storage zones. It should also be recognized that further specialization of characterization is required when contamination is deep, or when it occurs in different types of bedrock.
At this stage, the key is to use the DNAPL CSM to define data quality objectives for each zone, potentially subdivided further based on hydrostratigraphy for large plumes with complex geologic settings. Guided by the knowledge of the behavior in the transport zones and storage zones, it is possible to begin optimizing the application of tools and adapt the frequency and location of quantitative sampling necessary to delineate the source and dissolved-phase plumes. Practitioners should focus on tools that enable remedy decision making and risk assessment early in the process to avoid having to repeat quantitative sampling at field-screening locations, especially when it is impractical to correlate quantitative results with field screen measurements.
Monitoring wells as traditionally constructed and used are not recommended as primary characterization tools because of vertical and volumetric averaging of contaminant concentrations associated with this type of sampling. Bias is also introduced in how wells are sampled, because the volume and intensity of sampling further impacts the vertical and volumetric averaging, making conclusions based on monitoring wells subjective; however, the use of multilevel devices—packer and port systems allowing high-resolution characterization with traditional or emerging hydrologic characterization methods (for example, multilevel slug tests, hydraulic tomography), chemical sampling, and pumping or injection for remediation (alone or together)—allows for high-resolution characterization and remediation in wells constructed or adapted for multilevel sampling (Einarson 2006). Packers in the wells avoid concentration averaging or the migration of contaminants to new or less contaminated zones. For wells with sand packs in the annular space outside the screen, placement of bentonite rings at appropriate length intervals in the sand packs can disrupt vertical migration through this artificial high-permeability zone. In addition, wells (with or without screens and annular space and fill) and in-well equipment may be the best alternative in contaminated fractured rock aquifers and other aquifers where direct-push methods cannot be used. Regardless, upon completion of the delineation phase, it is appropriate to use monitoring wells to evaluate temporal trends and to begin answering specific questions about plume stability and attenuation. Therefore, it is important to develop well-specific monitoring objectives and tailor the design of the wells and sampling program accordingly.
The decision to perform additional characterization phases when developing remedy designs or optimizing performance should be weighed by the return-on-investigation (see